
You must be logged in as a Reports & Analytics Dashboard user to view the average percentage of time spent on orders confirmation out of the lead time.
Scroll down to the Lead Time circular diagram and select the desired date range. Wait a second for the data to calculate and review the Lead Time diagram. Click on the Average Time to Confirm segment.
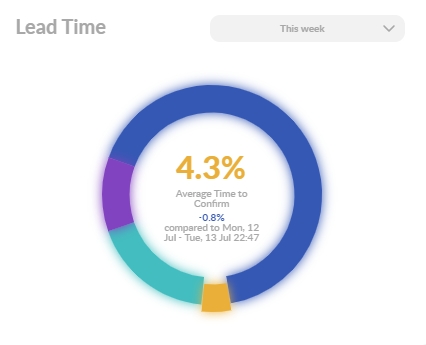
Average Time to Confirm is the time spent by the operator to get the Planned Dispatch Time from the kitchen then to confirm the order with the customer. By default, it shows the percentage of the Average Time to Confirm out of the Average Lead Time. You can hover your mouse cursor inside the circular diagram to find out the actual Average Time to Confirm in minutes.
Also, if you have multiple brands/domains, you can click the appropriate segment on the Brand Share circular diagram to find out the Average Time to Confirm percentage of that particular brand’s orders.
Comments
0 comments
Please sign in to leave a comment.