
The Data Export is the visual interface designed to provide you with a convenient tool to export data from each aspect of your food-delivery operations to an ERP or any other software you may use to manage your day-to-day business activities. The Data Export Dashboard allows you to export revenue summaries, transactions, cash flow, daily sales, orders, dishes, modifiers, ingredients and accessories movement and consumption, customers and more. Everything can be exported in just a couple of clicks for any given date or period of time.
In order to use Data Export, you have to log into the Delivety App as a user who has the Data Export dashboard assigned. Log in to the Delivety App using the URL your-domain.delivety.com/app (replace your-domain with your Delivety domain name).
Recommended Devices
The Data Export Dashboard can be used on any PC, Mac, iPad or Android tablet as well as on any iPhone or Android phone. We recommend using any computer (PC or Mac) to work with the Data Export Dashboard comfortably and effectively. Alternatively, you can use any mobile phone to work with the Data Export as it is fully mobile optimized.
User Interface Overview
The Data Export Dashboard consists of three interface elements: Toolbar, Data Export panel and Data Output panel.
The Toolbar is similar to the toolbars of other Delivety Dashboards and consists of the following elements:
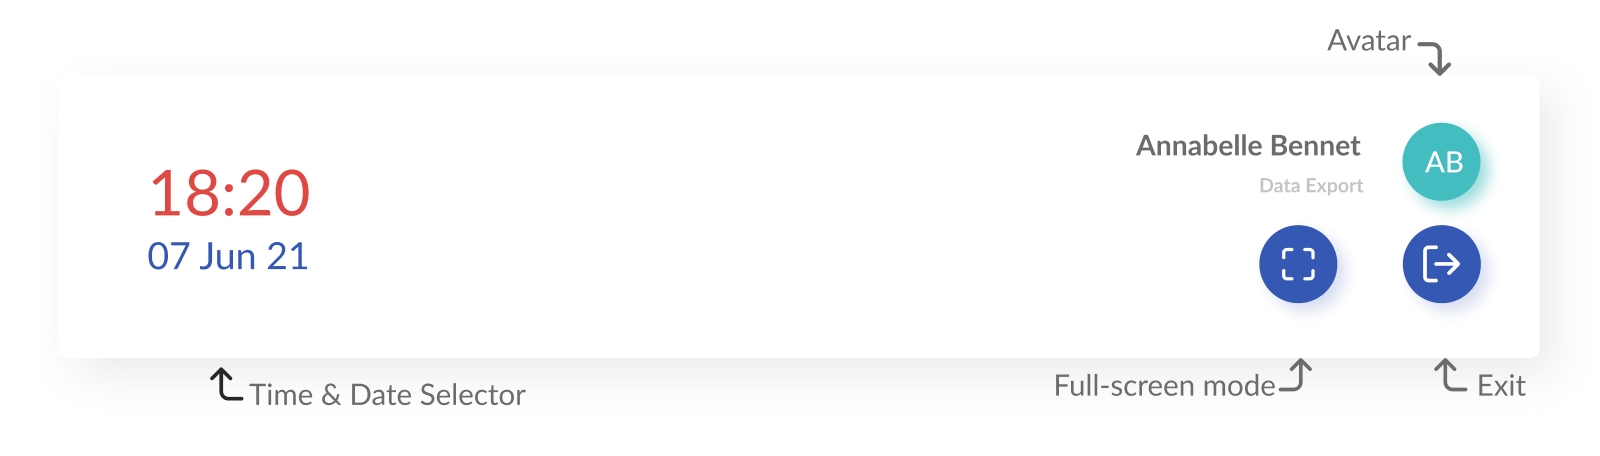
The Time & Date Selector shows the current time and date.
The Avatar button opens the buttons listed below and the dashboard selector that allows you to switch between the dashboards if you have multiple dashboards assigned. Next to your avatar, you can see your name and a list of the dashboards assigned to you. Clicking on the Avatar also shows the following buttons:
The Full-Screen mode button opens the Data Export Dashboard in the full-screen mode.
The Exit button logs your user out of the Delivety dashboard.
The Data Export panel consists of the following elements:
The Time frame picker allows you to select a time period to provide the reports for. By default, it is set for Today, so you can always see how the current day's sales are going. Just hit the refresh button when needed.
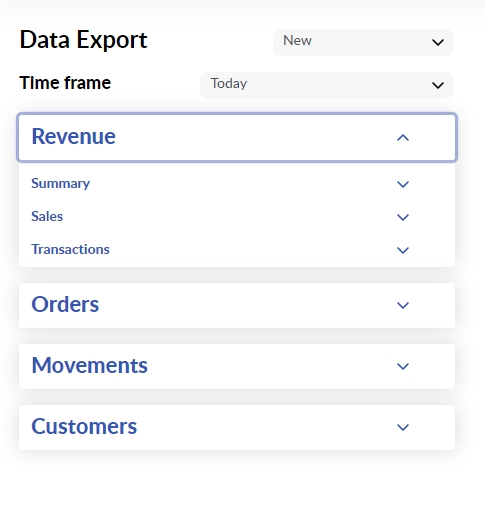
The Data Export Template Picker allows you to select a previously saved template with preselected data set and columns prearranged. By default, it is set for New, so you can always save the current data set in a template by clicking on the SAVE TEMPLATE button.
The Time frame picker allows you to select a time period to provide the data for. By default, it is set for Today.
The Revenue tab allows you to export the total revenue for a selected period of time. You can generate the Revenue Summary by choosing dates or Sales or Transactions when you export. Inside each subtab, you can tick the various data checkboxes: Date, Time, Transaction ID, Customer ID, Total Amount, etc.
The Orders tab allows you to export the detailed orders data, including ordered dishes, modifiers, the applied delivery fee as well as the other details, such as status, courier, delivery time, etc.
The Movements tab allows you to export the Dishes, Modifiers, Services, All Items, Ingredients, Accessories movements and consumption data. Inside each subtab, you can tick the various data checkboxes: ID, API ID, Title, Quantity, and Total Amount for each item you export data for.
The Customers tab allows you to export the detailed customers data. This tab will be available to you only if you have the Export Customers permission set in the Admin Panel. Inside this tab, you can tick the various data checkboxes: Phone number, Name, Average Check, Number of Orders, Total Amount, etc to export the customers’ data.
The Data Output panel consists of the following elements:
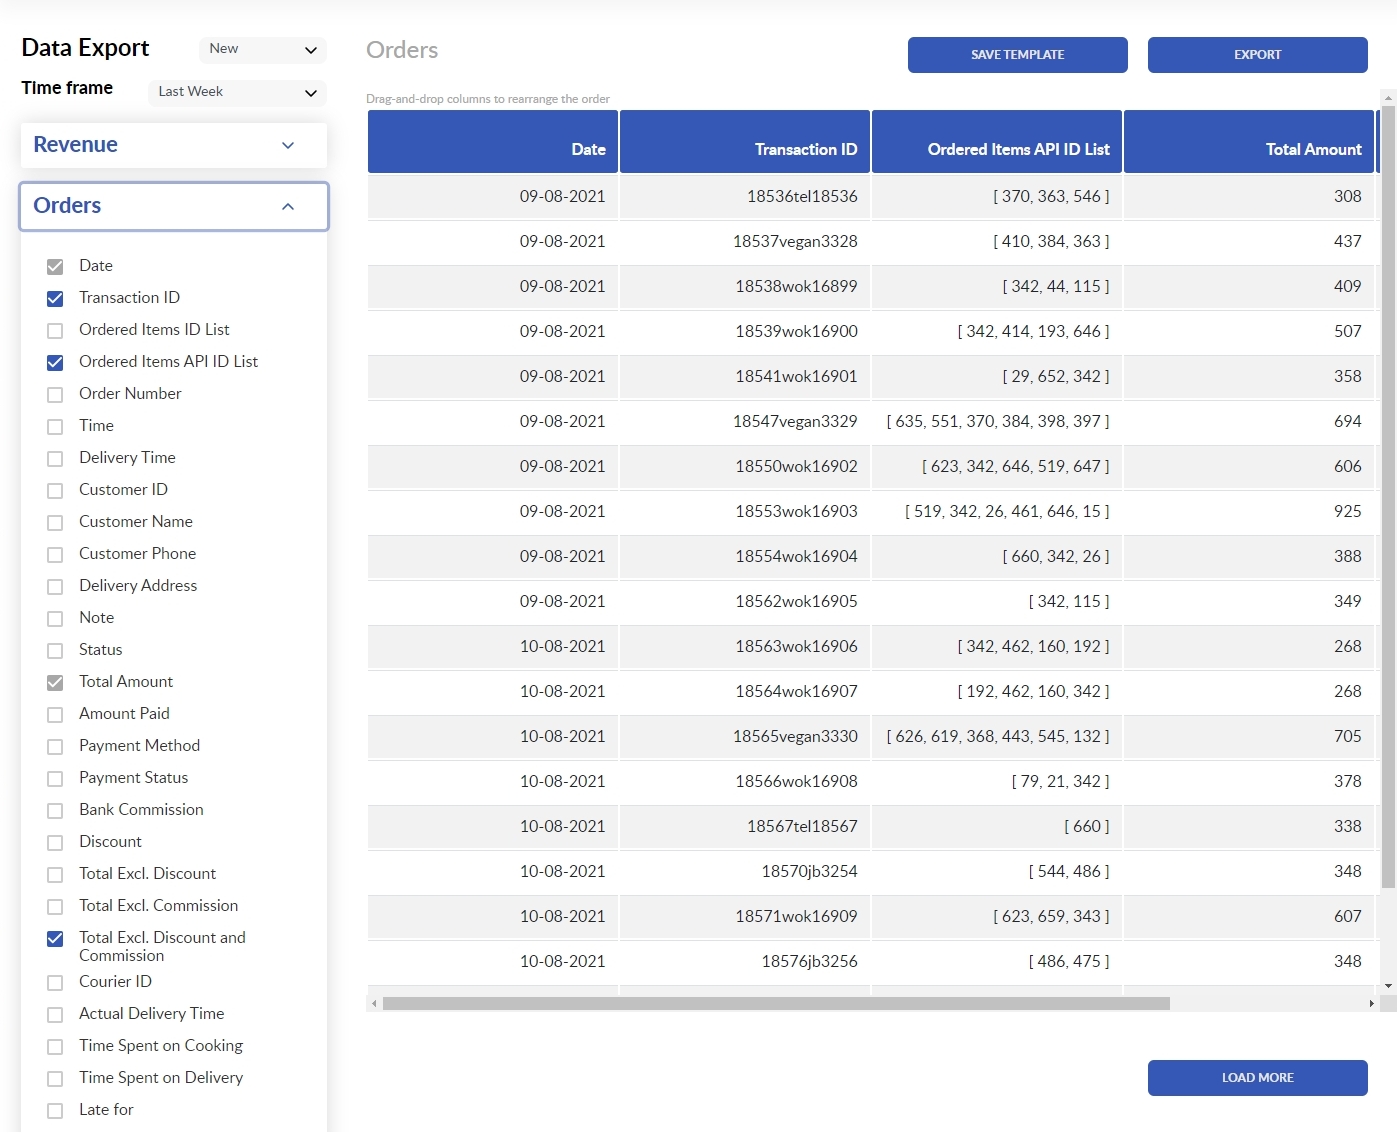
The SAVE TEMPLATE button allows you to save the data set as a template, so next time you will not have to tick the checkboxes and rearrange the columns. All you have to do is just to select the appropriate template next to the Data Export title.
The EXPORT button opens the Export Settings dialog where you can adjust the data format if needed and export it to a .csv file.
The Data Table shows the data exactly as it will be exported. Here you can drag and drop the columns to rearrange their order in the way it’s required by the software you will use to import the data. In other words, this will affect the order of values in the exported .csv file.
The LOAD MORE button allows showing more values in the Data Table in case they exceed twenty rows.
Comments
0 comments
Please sign in to leave a comment.