
The Reports & Analytics is the visual interface designed to provide you with an understanding of the necessary improvements in your delivery operations. The Reports & Analytics Dashboard allows you to compare key parameters for different given periods so you can measure your achievements in a convenient, accessible way. If you have multiple brands or food delivery businesses, Delivety Reports & Analytics will also provide you with comprehensive data and analysis for each of your brands separately - or for all of them altogether.
In order to use Reports & Analytics, you have to log into the Delivety App as a user who has the Reports & Analytics dashboard assigned. Log in to the Delivety App using the URL your-domain.delivety.com/app (replace your-domain with your Delivety domain name).
Recommended Devices
The Reports & Analytics Dashboard can be used on any PC, Mac, iPad or Android tablet as well as on any iPhone or Android phone. We recommend using any computer (PC or Mac) to work with the Reports & Analytics Dashboard comfortably and effectively. Alternatively, you can use any mobile phone to work with the Reports & Analytics as it is fully mobile optimized.
User Interface Overview
The Reports & Analytics Dashboard consists of three interface elements: Toolbar, Reports panel and Analytics panel.
The Toolbar is similar to the toolbars of other Delivety Dashboards and consists of the following elements:
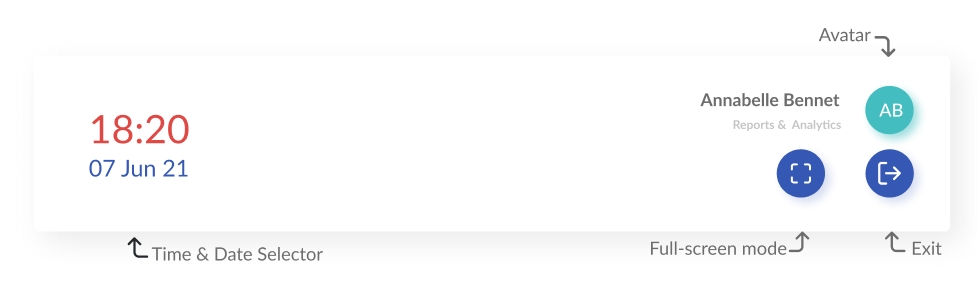
The Time & Date Selector shows the current time and date.
The Avatar button opens the buttons listed below and the dashboard selector that allows you to switch between the dashboards if you have multiple dashboards assigned. Next to your avatar, you can see your name and a list of the dashboards assigned to you. Clicking on the Avatar also shows the following buttons:
TThe Full-Screen mode button opens the Reports and Analytics Dashboard in the full-screen mode.
The Exit button logs your user out of the Delivety dashboard.
The Reports panel consists of the following elements:

The Time frame picker allows you to select a time period to provide the reports for. By default, it is set for Today, so you can always know how the current day's sales are going - just hit the refresh button when needed.
The Revenue panel shows the total revenue for the selected period of time alongside the unpaid amount, card sales, cash sales and delivery fees. It also shows the Net Revenue, which is calculated as revenue adjusted by refunds, discounts and bank fees. These adjustment amounts are also shown for your convenience. Both Revenue and Net Revenue are shown compared with a similar time period in the past.
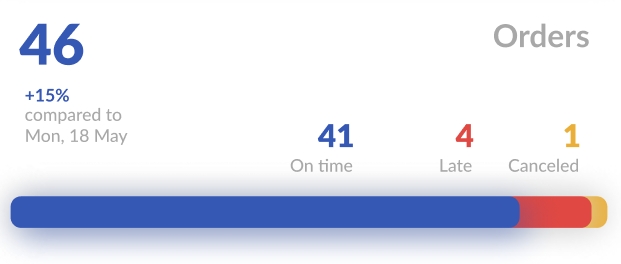
The Orders panel shows the total number of orders for the selected period of time, also compared with the similar time period in the past. There are also shown how many orders have been delivered on-time, late and canceled.
The Brand Share panel shows your brands/domains shares both by revenue and by orders. This panel is active only if you have more than one brand/domain active with Delivety. You can select a segment in the Brand Share circular diagram. This will show you the brand-share percentage and you will be able to view the absolute values if you hover the mouse cursor inside the circle. You can switch between your brands by clicking on the appropriate segments of the circular diagram. Also, you will see how these values compare to a similar period of time in the past. You can switch from Revenue to Orders using the selector to the right of Brand Share. This will show you the number of orders and their percentage for each of your brands. Kindly note, that the Analytics panel data depends on the brand you have selected. In other words, by default, the Analytics panel shows the data for all brands, however, once you select a brand, it shows the data for that particular brand.

The Analytics panel consists of nine line charts and three circular diagrams.
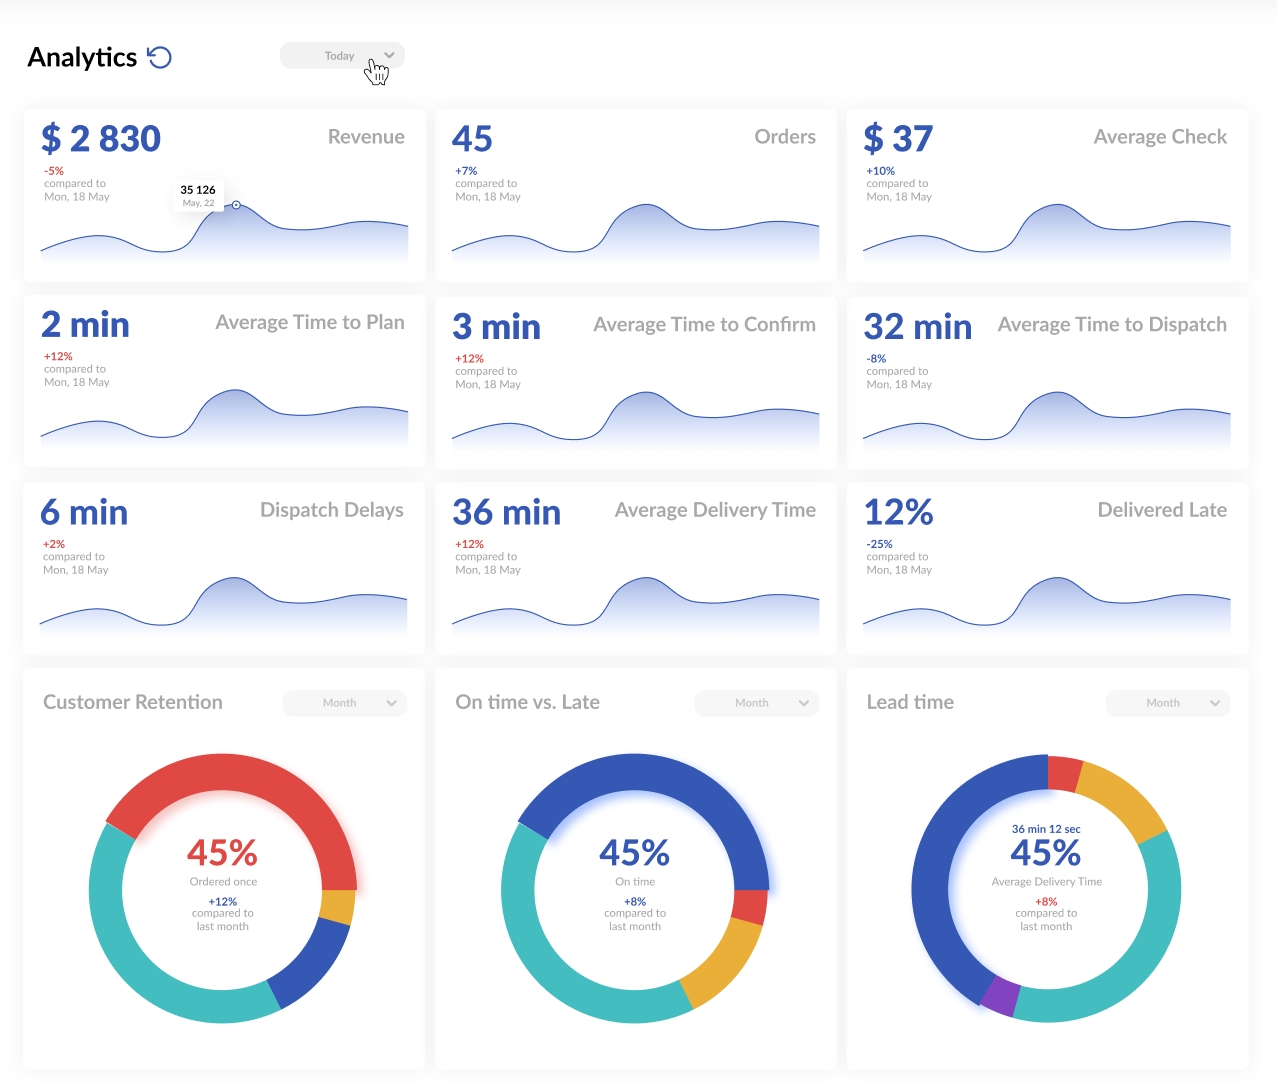
All the line charts have self-explanatory indicator names and are shown compared with a similar time period in the past. You can click on any line chart to enlarge it if you need more detailed information on the particular indicator’s dynamics by hours, days, weeks or months.
The Customer Retention circular diagram helps you to find out how many customers have ordered twice (or more) over a given period of time. You can click on the various segments to see the percentages of the customers who have ordered once, twice, three times and four times and more.

You can hover your mouse cursor inside the circular diagram to find out the actual number of orders for each segment.
Also, if you have multiple brands/domains, you can click the appropriate segment on the Brand Share circular diagram to find out the Customer Retention data for that particular brand.
The On-Time vs. Late circular diagram helps you to find out the percentage and number of the orders delivered late segmented by reason. You can click on the various segments to see the percentages of:
Delivery Delays caused by couriers missing the Delivery by time;
Kitchen Delays caused by kitchen staff missing the Planned Dispatch time;
Kitchen & Delivery Delays caused by couriers and kitchen staff.
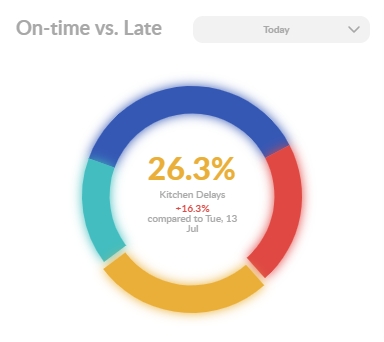
You can hover your mouse cursor inside the circular diagram to find out the actual number of orders for each reason instead of the percentage.
Also, if you have multiple brands/domains, you can click the appropriate segment on the Brand Share circular diagram to find out the On-time vs. Late percentage of that particular brand’s orders.
The Lead Time circular diagram helps you to find out how long the order journey takes, on average, for the selected time frame. You can click on the various segments of the diagram to see the percentages of Average Time to Confirm, Average Time to Prepare, Average Time to Dispatch and Average Delivery Time.
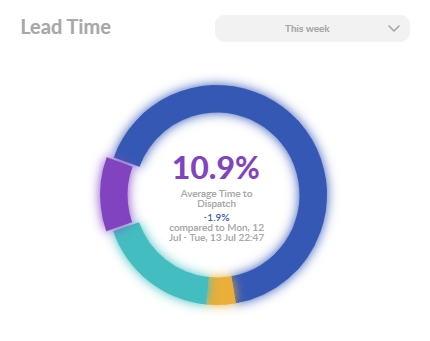
You can hover your mouse cursor inside the circular diagram to find out the actual time in minutes for each segment.
Also, if you have multiple brands/domains, you can click the appropriate segment on the Brand Share circular diagram to find out the Lead Time percentage of that particular brand’s orders.
____________________
Learn more:
How to find out the Revenue for a period of time
How to find out the card and cash sales for a period of time
How to find out if there are any unpaid amounts for a period of time
How to find out the delivery fees charged to the customers for a period of time
How to find out the Net Revenue for a period of time
How to find out the refunded amounts for a period of time
How to find out the discounted amounts for a period of time
How to find out the bank fees paid for a period of time
How to find out how many orders were received for a period of time
How to find out how many orders have been delivered on time
How to find out how many orders have been delivered late
How to find out how many orders have been canceled
How to find out if there are any unpaid orders for today
How to find out the brand shares for a period of time
How to find out the Average Check for a period of time
How to find out how long it takes, on average, the kitchen to provide Planned Dispatch Times
How to find out how long it takes, on average, for the operator to confirm orders with customers
How to find out how long it takes in average to dispatch the order
How to find out the length of average dispatch delays
How to find out the time it takes, on average, to deliver orders
How to find out the percentage of the orders that have been delivered late
How to find out what causes the delivery delays
How to find out the percentage and time of delays caused by kitchen staff
How to find out the percentage and time of delays caused by couriers
How to find out the average Lead Time
How to find out the average percentage of time spent on Orders Confirmation out of the Lead Time
How to find out the average percentage of Order-Preparation time out of the Lead Time
How to find out the average percentage of Waiting-for-Dispatch time out of the Lead Time
How to find out the average percentage of Delivery Time out of the Lead Time
How to find out the Customer Retention data
How to find out how many customers ordered twice (or more) for the given period of time
Comments
0 comments
Please sign in to leave a comment.